2pt
A Results section of your report should start with a paragraph telling the reader how the results were organized and presented. If the data are voluminous, they can be put in an appendix, but choose a representative test and include it in this section. Calculated results are identified as such by labeling these columns in the table, using a separate table or, for complex calculations, including a Calculations subsection. This ensures that the reader knows specifically what was measured.
You will most likely have a table of measured values and graphs of different variables. A table and graph are given here as an example of how to integrate them into your text. Proper formatting of figures and tables is described in Chapters 6, 7 and 8. In the text, write a statement such as:
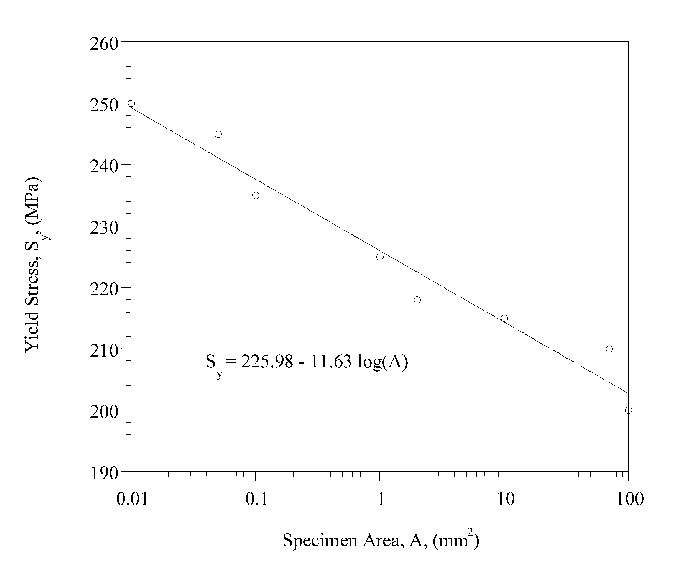
The specimen dimensions and failure loads are given in Table 4.1 and a graph of the observed variation of yield strength with specimen area is shown in Figure 4.1. This figure shows clearly that the yield strength of the material decreases linearly with the logarithm of specimen area for the cross-sections examined.
All measured data should be included. If, for valid reasons, you have
omitted data, it should still be presented. You can state the reason
for the exclusion here, but how you came to your decision should be
explained in the Discussion. Unexpected values should also be pointed
out in the Results section but must be discussed later. Give an
example of how you calculated reported data. This can be part of this
section or, if lengthy, presented in full in an appendix. Subsection
4.6.1 outlines how this should be done.