| A Military Writer's Handbook | |||
| Formats and Guidelines | |
|
Mechanical
Engineering Style Manual Introduction These guidelines are provided to assist you with preparing professional reports for any of the mechanical engineering courses. Many of the suggestions in these guidelines are based on the experiences of different professors and their preferences. You should be prepared to adapt these suggestions to your specific project, make improvements and develop your own style of report writing. Why do you have to write reports, anyhow? The trivial answer is because they are a course requirement and you would like to get a good mark in the course. However, in your career you will be faced with the same scenario, in different contexts, time and time again. The ability to write clear, concise, effective reports will greatly enhance your credibility and increase your chances for career advancement. Reports also provide permanent, legal documentation of work completed, methods employed, conclusions, recommendations, etc. Effective report writing (and the associated graphical and analytical techniques) requires a great deal of conscientious practice and it is one of the most valuable skills you can acquire. An engineer who cannot communicate effectively in writing is virtually unemployable. Now that you are convinced (we hope) that reports are a necessary evil, how can you minimize the effort required to produce a good report? The answer to this is to organize. A well-organized report is easy to prepare and easy to read. Different types of reports will require different styles. Most report styles share some common ground. So, to avoid repetition, this document is divided into three parts. The first part describes the overall style of the different types of reports you will be asked to write and specifies in which order you should present the major sections. The second part defines a style in which to present each section. The final part describes techniques to be used to produce proper figures (graphs, equations, tables, illustrations, etc.) Almost all reports contain an introduction. Hence, both the description of laboratory reports and design reports in Chapter 3 will include an Introduction section. The specifics of how to write a good introduction will, however, be included in Chapter 4. Report writing items common to all sections are described in Chapter 5. How to include photographs, typeset equations, etc. in your introduction, discussion or any other section will be described in the last chapters, namely 6 through 10. The primary aim of a report is communication. Like any other literary work, this form of communication can, if improperly done, be tedious and dry. In all undertakings which demand skill, one learns by doing. The easiest way to improve your technical writing is to read technical reports. This is somewhat difficult at the undergraduate level due to a lack of material. One underused resource is the library. It is often asked of the engineer that a literature survey of existing knowledge be done when undertaking a new project. This time should be spent not only understanding scientic and technical knowledge, but also studying how it was communicated to you. Once you have absorbed the technical content, reread the document with a purely literary approach. Compare the authors' style to what is proposed in this document. What are their strong points, their weaknesses? Their objective was to communicate their material to you, the reader. Did they achieve the objective and how? Did they fail to some degree? If so, why? Learning from the successes and failures of others will greatly improve your writing. A brief comment on style. Quality newspapers and publishing houses pay editors large sums of money to ensure that a certain style is maintained in their books, magazines, technical journals and newspapers. The term style here refers not only to the look (choice of font, size of paper, cover art) of the document but also how its contents are presented. This includes proper grammar and syntax, defining standards for the preparation of tables and figures and preparation of indices and tables of content. Think of a style manual as a compilation of all guidelines for the preparation of a document. The style of a report cannot help but impress the reader. The technical report is the major medium of communication of the engineer and, as in any form of communication, it best achieves its purpose when it is both clear and concise. A poorly prepared document, illogical in its presentation, careless in such details as units and figure identification, unclear in its separation between observed data and calculated results, etc. lacks credibility. A reader attempting to understand a disorganized and confusing document can only assume that the experiment was conducted in like fashion; at best it will be suspect, at worst it will be dismissed as useless. Written Documents The way humans communicate using the written word is highly standardized. In the western hemisphere, this standard is uniform apart from a few language dependent idiosyncrasies such as hyphenation and punctuation. One expects that a book will have its table of contents at the beginning and its index at the end. This is one of the intuitive aspects that we actually learn early in life. Where di.erent parts of a document should appear has been formalized by publishers. The most commonly used style in North America was laid out by the University of Chicago Press in A Manual of Style [1], now in its fourteenth edition. We use this standard not only because it is required by the publisher or the professor but also, and most importantly, because it is what the reader expects. Though the writing of books is beyond the scope of this document, all reports follow a similar standard. So let us briefly study it here. Any manuscript, book or report can be divided into three parts. The Chicago Manual of Style gives an outline of the major divisions of a book. Though your report need not contain all of these divisions, it is useful to understand this structure. To quote the manual [1]:
Table 2.1 is quoted directly from A Manual of Style [1] and is the University of Chicago Press's guideline to a proper book. This is the format that inspired what you are to use in the Department of Mechanical Engineering. Each of the precisely laid out styles described in the following chapters was prescribed by this scheme. Each style will include some of the divisions presented here. This document will specify more clearly what the text or main matter should contain. Because this manual is in the form of a book, the style of the present text differs from that of a report. Do not use it as a guide. Examples appear in the appendices of both report styles. They can be used as a benchmark. The aim of these styles is not to impose a draconian set of rules upon you but rather to help you to sort out where and how certain ideas should be presented. These styles are flexible to a point. If not followed closely, your document may still be readable but most will find it awkward.
*The items in this column refer to which side of a page the section starts. ReportsThis chapter dictates what type of information should be included in different types of reports. It also prescribes in which order to present the required material. Items deemed optional seldom are. It is highly unlikely that a report of any kind would not contain a single table but it is possible. Should this be the case, a List of Tables would be unnecessary. Specifics about each section are given in Chapter 4 of this style manual. 3.1 The Laboratory Report This style of report is most common in research and consulting firms. In your military career you will most likely be asked to evaluate this type of document prepared by external sources. Recent examples of this type of study done at RMC for DND include fatigue studies of aircraft alloys, coking in marine diesel engines and groupings of small weapons fire. A laboratory report specifies what was sought, how it was sought and why it was sought, preferably not in that order. Such documents are usually prepared using the sections described in Table 3.1. Due to its length, you will rarely be asked to write up laboratory reports except perhaps in the engineering project course (MEE471). The short laboratory report style outlined in Table 3.2 is preferred so that students can concentrate on developing writing skills in the most important sections. 3.2 The Design Report When you are required to design or redesign a device, this report style is used to communicate exactly how the design was done. You will have to prepare such a report in your design course (MEE303) and perhaps in your engineering project course (MEE471). The design report presents why the design was undertaken, what exactly was required to be built, what choices were made and why, and finally depicts the exact design as specified by the included drawings. Table 3.3 contains the sections that are found in any good design report.
* Items deemed optional seldom are.
Sections This chapter outlines all the possible sections that you will encounter in all types of reports. 4.1 Abstract The abstract is a brief (one or two paragraphs) description of what you did and what you found. You may also include a sentence or two about why you did whatever you did, if you feel it is important. The abstract must not be a summary of your thought processes for writing the report. Do not write "the experiment was completed, the data was analyzed, and conclusions were drawn." Remember, the higher a person is in an organization, the less likely he is to read the entire report. The top managers will often read only the abstract (and if this is interesting, they may read the conclusions) and decide whether or not your project was worthwhile. Also, abstracts of engineering reports and scientific papers are made available to other researchers through computer data bases. Since a potential reader may have to sift through a lot of abstracts, the relevance and quality of your work may be judged on the basis of your abstract alone. Therefore, the abstract must stand on its own. Included below are two examples of abstracts from students' reports received in recent years (modified to protect the innocent).
This abstract is poorly written because it is vague, imprecise, and inaccurate. The objective of the project is not clear, what was done is inadequately described and mostly irrelevant, and the parameter to which the quoted values belong (i.e., fracture toughness) is not identified. Note how the important information is clearly and accurately conveyed in the following good abstract:
An abstract should allow a senior engineer to decide if your report is relevant to a particular effort or, alternatively, indicate to a researcher if your report is worth the time and effort that goes into acquiring and understanding it. 4.2 Nomenclature This section is vital if you want someone to understand what the equations in the report means. It is a list of all variables used, their physical representation and their units presented in tabular format. Since variables are a mathematical abbreviation used to lighten the text (mathematical or literal), you must make available to the reader a list of all abbreviations used. When many variables are used it is somewhat advantageous to separate the variables into four tables: roman uppercase, roman lowercase, Greek uppercase, Greek lowercase. If a complex system of subscripts and superscripts is used (as in thermodynamics or tensor calculus), these merit their own separate table. Section 9.2 gives sources for standardized nomenclatures. 4.3 Introduction The introduction to your report should provide background knowledge about the subject and a clear statement of the objectives of the project. This means that you have to do some research on the subject (yes, open a textbook or even take a trip to the library), recall what you actually did, and then get it down on paper in a clear and logical fashion. It is sometimes good to include two subsections in your Introduction: Background and Objectives. The Introduction helps the reader understand the subject. The Background subsection should convince the readers that the subject is important, and should provide them with enough information to understand the results and analysis that follow. The Objectives subsection should state clearly what you hope to accomplish in the project. Remember, scientists generally do experiments to test theories, seek evidence to support hypotheses, or determine measurable effects of various inputs on physical systems. They never do experiments to prove or to show an expected result. For example, you may say that the objective is to determine how the hardness of an aluminum alloy varies with the amount of cold work . Do not say that the objective is to prove that hardness increases with the amount of cold work. Similarly, engineers generally run tests to determine the performance of some system under controlled conditions, or the response of a system to variables, or the properties of the system (e.g., materials), etc. The engineer's purpose is often to learn how the system behaves so that this information can be used to guide analyses, modifications or future designs. If you are designing or redesigning something, the need or reasons for the design should be stated in the Introduction. Do not state the properties of the object but rather the motivations behind the creation of this new object. The Introduction can include an overview of the reasons for failure of the old design, the new use of the object that is causing problems or the research that has proven the need for the environmentally friendly self-propelled follicle enhancer (bald spot paint in a can). Once you have identified your objectives, you should make sure that the following sections all serve to show that the objectives were met, or, if not, why not. For example, if one of your objectives was to determine how the hardness of a material varied with the amount of cold work, the following material would be expected: a graph of hardness versus amount of cold work in the Results, a description of the metallurgical mechanisms involved with cold work including their effect on hardness in the Discussion, and a statement about the form of the variation in the Conclusions. Or, if the 0.1 litre per hundred kilometre family car was the (unattainable) objective, the performance prediction section of your report should clearly show why this is impracticable. 4.4 Theory If the project requires a design method or some special analysis to interpret the results, then you may need to have a section dedicated to Theory. Such a section would likely contain theoretical and/or mathematical developments. The typesetting of mathematical equations and how they should be referenced is discussed in Chapter 9. Make sure that there is enough new material to warrant a separate section in the report. If the analysis is relatively simple and short (e.g., a few equations) it can be presented in the Introduction, in the Discussion, or it can be included in the Results. If you have detailed analyses that are not essential to the interpretation of the results, you must certainly mention them but you should include them in an Appendix. If the analysis or method was taken from referenced material, do not repeat the derivation. Cite the author, give a summary of the assumptions and general theory, and then produce the final result. However if you are substantially modifying a theory or design method, it is best to reproduce it to situate the reader. This will facilitate the comparison of the two schemes. You will sometimes be required to use theory derived from two different sources. Due to personal preferences of the authors, the nomenclature of variables will most likely be incompatible. Faced with this dilemma, choose one of the two nomenclatures and rewrite the second source using the new nomenclature. Using many different letters to express the same variable leads to great confusion. Complicated derivations are by definition hard to follow. Do not make them incomprehensible by deleting seventeen steps and stating it can be shown that or it is obvious that. What is obvious to the author is usually hard to find out for the reader. A mistake in a venerable electromagnetic theory textbook 2 was recently corrected by sifting through seven different instances of it can be shown that . The author had lost a minus sign in three of these shortcuts. To make the task even more daunting, two of these mistakes cancelled each other out. This implied that intermediate formulae in the derivation were sometimes erroneous, sometimes accurate. Finding the correct derivation was tedious. A Theory section is often used as a filler to make the report seem important (by its sheer size and weight). This tactic is usually self-defeating. Many supervisors will flatly refuse to read a report until it has been condensed to a reasonable length. To coin a new adage: the thickness of the report often reflects the thickness the author. 4.5 Materials and Methods A Material and Methods section of the report should contain relevant, concisely presented information about the materials examined, apparatus used, and experimental procedures employed. If standard tests were used, then simply reference these standards and state that they were followed. If a modified form of a standard procedure was used, then give the standard reference and describe any significant deviations from that standard. If a new procedure was developed, or if an obscure procedure was used, then you should describe it in detail. Similarly, if new apparatus or equipment that is signi.cant to the overall project was designed, then it should be well documented. The easiest way to do this is to create a design report and refer to it. If such a report is not readily available, it can be included as an Appendix. In laboratory reports, it is good practice to include a schematic drawing in the main body of the Materials and Methods sections. Schematics are usually devoid of all non-essential information so that readers can quickly grasp the important features. Present large lists of materials and properties in a summary table. Specify exactly how samples were prepared and any special precautions that were taken. If this is long and complicated, it belongs in an appendix. This is important for persons trying to reproduce your results. This can have important repercussions as shown in these two anecdotes The discovery of insulin by Nobel prize winners Banting, Best, Collip and Macleod was delayed because of such details. Collip a young biochemist first isolated a pure extract of the life saving material but did not take sufficiently detailed notes of his procedure. He found that he could not reproduce his first success. It took a full year before the complete technique was rediscovered by the team of Banting and Best. Two graduate students of Dr. Leonard, a chemist at Laval University, were working on a new polymer in the 1990s. Two identical apparatuses were used to measure reaction rates. However one lucky student could instantly create the plastic no matter what temperature was used. The other, try as he may, could not reproduce the results. It was found after a long search that one stopcock in the lucky student's apparatus had been lubricated with a new type of grease. This grease contained a molecule that acted as a superb catalyst. From this we glean not that one should list the chemical compositions of all greases in the report but that minute details such as which grease was used can become important and should be noted. Remember to be thorough. Include all information required to exactly reproduce your experiment. What seems like a detail to you could be a most important fact in someone else's research. 4.6 Results A Results section of your report should start with a paragraph telling the reader how the results were organized and presented. If the data are voluminous, they can be put in an appendix, but choose a representative test and include it in this section. Calculated results are identified as such by labeling these columns in the table, using a separate table or, for complex calculations, including a Calculations subsection. This ensures that the reader knows specifically what was measured. You will most likely have a table of measured values and graphs of different variables. A table and graph are given here as an example of how to integrate them into your text. Proper formatting of figures and tables is described in Chapters 6, 7 and 8. In the text, write a statement such as:
All measured data should be included. If, for valid reasons, you have omitted data, it should still be presented. You can state the reason for the exclusion here, but how you came to your decision should be explained in the Discussion. Unexpected values should also be pointed out in the Results section but must be discussed later. Give an example of how you calculated reported data. This can be part of this section or, if lengthy, presented in full in an appendix. Subsection 4.6.1 outlines how this should be done. 4.6.1 Calculations Examples of all calculations used in data reduction must be presented. This implies the proper typesetting of equations as discussed in Chapter 9. Choose one set of raw results and carry out all calculations that lead to the calculated data that will be discussed later. Choose data that are representative of the whole lot. The first data taken are usually a bad choice since you are still unfamiliar with the measuring devices. It is important to start out with raw results to ensure that all calculations can be reproduced. If stress was measured using a transducer whose output is in volts, include a sample of a calculation reflecting the conversion of volts to megapascals.
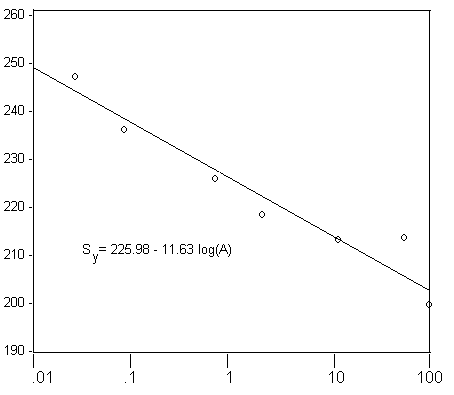
Figure 4.1: Yield Strength of Dukalloy Specimens Having Different Cross-sectionsAll calculations using theory presented in a previous section of your report should be referred to as such. For example, a preamble to a sample calculation could be: strain was calculated using Equation X.X. Do not reiterate what is implied by Equation X.X. It can be found in your theory section. The Calculation section can be tedious to read, especially to one who is verifying the correctness of the calculations. Make it thorough but concise. Use an appendix if large sets of calculated data are involved. Show sample calculations that lead to intermediate values but do not tabulate these values. Tabulate any values that will be used in later sections of your report. When preparing results containing measured and/or calculated values, remember to make sure that the number of significant digits is meaningful and reasonable. To do this you must carry out uncertainty calculations. For example, if reporting a calculated yield stress, more than three significant digits are likely to be unreasonable. It is common to find yield stresses such as 345.124MPa listed in lab report results. This is an unreasonable number. The load cell of a typical testing machine has a relative uncertainty of 0.1%, which represents approximately 0.4MPa for the stress in this example. On the basis of this condition alone, the yield stress of the sample could actually be as low as 344.7MPa or as high as 345.5MPa. Furthermore, taking into account the inherent variability between samples (easily 1%), one soon realizes that the yield strength of the material can only be represented reasonably by a number like 345MPa based on realistic and careful measurements. Do not forget to present the units for all the results in a table. Units and units conversions are a necessary evil of engineering calculations. Show units conversions in sample calculations. It is bad practice to hide conversion factors in proportionality constants. Heywood [5] gives a perfect example of this misleading technique stating that in U.S. units (whatever those are) engine power P can be calculated from engine speed N and torque T using Equation 4.1. The value in the denominator is not a constant but a conversion factor that not only masks the conversion of shown units but also the conversion of revolutions to radians.
4.7 Discussion In this section, the opportunity exists to discuss the relevance, utility, advantages or disadvantages, etc. of the work that was done and the results that were presented. Explain all the significant observations with direct reference to the theory. Comment on any surprises or anomalies that were encountered, and offer explanations for whatever outcomes were observed. Speculate if you wish, but distinguish clearly between fact and speculation. The discussion is usually the most important section in the report. It is in this section that students can demonstrate their own ability to analyze, interpret and critique the results of the experiment as well as exercise their expertise in technical writing. The clarity and completeness of the discussion will have a major influence on the assessment of the report by the reader, and typically has a large weight in the total mark assigned. Topics that could appear in the Discussion section are :
4.8 Conclusions The Conclusions section should be a summary of the main findings of the report. Although conclusions and results go hand in hand they are different in one main respect. A result is a quantifiable finding such as the maximum power of a Volvo B20B engine in the P1800 is 89.5 kW (120 HP). Applying reasoning or analysis to a result renders a conclusion. For example using the measured result of maximum power of the B20B engine to state that 89.5kW is more than enough power for such a light (and stylish) car as the P1800 is a conclusion. No new material should be presented. A general rule is: If it does not appear in the body of the report, it cannot appear in the conclusions. Review your objectives, and make sure that the conclusions satisfy and relate directly to your objectives. If a conclusion does not relate to objectives, consider deleting it. If you still want to present it, include it at the end as a collateral finding. Do not conclude facts or ideas from the introduction: e.g., 16 the usefulness of the experiment or the project. Conclusions should concentrate on the results of the work; i.e., what was discovered through completing the project. If you have recommendations, they should be included in the paragraph of the conclusion from which they logically follow. If many recommendations are suggested then they should have their separate section. The Conclusion section or the Recommendations section, if there is one, is usually the section that is most often read after the abstract. 4.9 Recommendations In some reports, you are required to make recommendations arising from the study or work that was carried out. These should not be taken lightly. Think carefully about the changes or actions you suggest and be prepared to justify them. Often this is an appropriate opportunity to point out the potential for future work. They should relate directly to the conclusions made, and should appear in that section. Conclusions do not necessarily have recommendations but recommendations are always based on one or many conclusion. If they are numerous they should be reiterated in a section other than the Conclusions, but no new material should appear in this separate section. 4.10 References To ensure clarity, the definitions of certain words are restricted as follows:
Any part of your report that quotes or cites or presents any information obtained from a previously published (or to be published) document, must be properly referenced. Section 10 discusses how to do this without inadvertently plagiarizing. Citation serves two purposes. It gives credit to those who have done the work being used or quoted, and eliminates the need to reproduce volumes of data or information in the report. The list of sources for this supportive material would normally be called a Bibliography or List of References. Technical reports contain References. The term Bibliography is usually left to the humanities or substantial scientific works such as books, handbooks or textbooks. Reference material adds validity to your research. All scientific advances are built on previous knowledge. Citations allow the use of that foundation and associated credibility. Citing is not a legal way of copying. Citation provides a concise way of incorporating the research of others so that comparison is possible. Extremely useful papers called reviews are comprehensive pertinent citations on one subject. Reviews contain no new material. However, they serve to consolidate the state of the art in one concise document. There are many ways of referencing material in the text, each with a corresponding layout in the Reference section. The humanities treat this subject completely differently. Even within the natural sciences there are many standards. Engineering holy wars get started by discussing such subjects. One popular method of referencing material in engineering reports and publications is to cite the publication in the text using a number placed in brackets. The complete reference to the material then appears numbered in the Reference section. The information contained in the complete reference depends on the type of material. Normally the information is presented in the following order: authors, title, volume, publisher, year, page number. The title of a book or journal should be capitalized and italicized. Only the first word of the title of a paper in a journal is capitalized (and not italicized). You will find examples and their formats for most types of references cited, including web pages, in the Bibliography section of this manual. These are a few additional notes about references that are a question of taste but will be imposed on you for uniformity’s sake:
4.11 Appendices An appendix should contain useful supporting information in which the intended audience may be interested, but which is not essential to understand the report. Do not use the appendices as a garbage can for pages you do not know what to do with such as rough calculations. Put only relevant information into the report. This applies to the appendices as well. Some rules for appendices are:
In the military style of writing, an accompanying body of information would normally be called an Annex, and accompaniments to Annexes are called Appendices. In general, however, Appendices are preferred to Annexes in technical report writing. 4.12 Design Specifications This section is specific to design reports. At some point in your career you may be asked The Design Specification section lays out exactly what has to be made. General objectives are not enough. The exact specifications that are going to be met must be listed here. If they were not expressly dictated by the client they must be determined and approved by the client. The easiest way to accomplish this is to follow the scheme proposed in your design course (MEE303). Include in the Design Specification section a complete list of the properties of the technical system. This list can be lengthy and a table is usually appropriate. Table 4.2 gives a short example of the possible properties of a pen. Do not list why the client wished such properties for the technical system. Mont Blanc and Bic pens are respectively, expensive and inexpensive because that is what those manufacturers wished to produce. These are marketing decisions that do not belong in a technical report. 4.13 Solutions A Solutions section appears only in design reports. It describes exactly how the final solution was reached. Hence it must include all the options that were considered. Again you are referred to the Design course (GMF303) for how to come up with and evaluate design options. If you have divided your technical system into many subsystems, this section should have subsections for each. Tables are the tools of choice for presenting information in this section. 4.14 Evaluation This section lays out how you compared each different proposed solution. It should include the evaluation scheme and the scores of each solution. If a large problem was tackled and you have subsystems, this section should include subsections. Tables are particularly useful here to present large amounts of information in concise form. Give your preliminary engineering calculations that were needed to evaluate a solution. Some equation typesetting may be required here.
Table 4.2: Abbreviated Properties of a Mechanical Pencil 4.15 Design The final design is presented in the Design section. Such a section describes exactly what is to be manufactured. The operation of the technical system and how it satisfies the specifications comprise the main body of the text in this section . The exact description of the technical system is the drawing package. In Canada and most of the western hemisphere, this is the only legal means to specify what an object is. If these drawings are too voluminous or are on large sheets, they should be included in an appendix. Do not describe each part in detail; that is the main role of the detail drawings. Even though the drawings should express exactly what is to be made, novel manufacturing methods or assembly precautions should be included. It is a mistake to reiterate the justification for design choices. The Design section also includes all engineering calculations that prove that the system will meet the desired specifications. Include a reference to the theory behind each calculation. Do not repeat the theory unless you had to modify it. State which assumptions were made. Equations must be properly typeset9. If the calculations are lengthy, they can be summarized here and also put in their entirety into an appendix. 4.16 Testing Design reports often include a Testing section to verify that the design meets the specifications. Because the design and testing teams are different in most companies, this section is often in the form of a laboratory report that is included as an appendix. However if the testing is brief or pertains only to a specific part of the complete technical system, it can be included in this section of the main body of the report. No matter where it appears, it should follow the outline of a laboratory report. Commonalities Here is a list of details that are common to all reports. 5.1 General Appearance Reports must be legible and printed on US letter (8-1/2” × 11”) paper. Word processing is the medium of choice, but may be unduly time consuming, particularly for sections of the report involving large numbers of equations. Modern computing practices and the facilities provided for the students mean that it is no longer acceptable to submit hand written reports. It is required that reports be presented single sided so one need not worry if a section should appear recto1 or verso (for they all shall be recto). The report may be stapled or spiral bound, and should include a cover bearing a title page. 5.2 Margins & Justification The text should be fully justi.ed2. The first line of all but the first paragraph of each section and subsection should be indented the equivalent of five spaces (five em spaces)3. The leading4 in reports is usually left to be 2 points. This would make it the equivalent of a typewriter’s single spaced. However because your reports are also an academic exercise that your professor will mark (evaluate and scribble on), we require that you make them one and a half spaced. The margins are set according to Table 5.1
5.3 Typesetting, Typewriting and Hyphenation Typesetting is the art of laying out exactly how the printed matter will look. This includes proper spacing of lines and paragraphs and ensuring that there are no orphans or widows. This was and is a very difficult task and good hand typesetters were the pride of printing companies. Some of the practices required in the preparation of typewritten manuscripts to be typeset are incorrectly being used today. To accommodate most typewriters that had but one font, publishers set out rules to facilitate the typesetting. Two of these have become bad habits still udes in wordprocessing and should be abolished. The first to be addressed is the use of underline for emphasis. In its time, underlining was an explicit direction to the typesetter to use italics. Second is the double space after a period. Originally the second space was used to compensate for the monotype of a typeface of the typewriter. In type, periods get kerned (nudged to the left in this case) towards the last word of a sentence. Because typewriters cannot do this, a second space was added after the period. This practice is especially disruptive when used with word processors. These programmes cannot tell if the spaces are consecutive and attribute the The appearance of word processed documents can be improved if manual hyphenation is done. This, however, is a very tedious task that must be done only when the final version is to be printed. It is strongly suggested that the students do not undertake this but instead tolerate the visually unappealing paragraph. 5.4 Typeface & Fonts The style of the characters used to print a book is called a typeface. Most typefaces have three different versions: roman, bold and italics. Each of these has a specific use in typesetting. The size of typeface should be no smaller than 12 point and no larger than 14. This is to accommodate thinner typefaces such as Times. Typefaces with serifs such as Times, Bookman or Courier are much easier to read and are preferred. The serifs trick the eye into seeing a line where none exists, guiding it towards the next word. Compare the next two sentences, the first with serifs, the second sans serif.
Sans serif typefaces are mainly used in advertising or as an eye-catching device. One proper use is in dictionaries where entries are in a sans serif typeface, sometimes bold, to make them stand out from the text. Some people prefer sans serif fonts for their division titles (as is the case in this manual). Italics, not bold, not capitals, not quotation marks nor underlining should be used to emphasize a word. Emphasis should be used sparingly and only when the correct meaning could be misinterpreted or an unexpected or foreign word is used. Fowler gives this example: “It would be an ultimate benefit of the cause of morality to prove that honesty was the worst policy.” The use of boldface type in the main matter is rare and should be restricted to headings, mathematical equations and book indices. The last use is only to note page numbers where a concept is first defined. 5.5 Numbering The numbering of all matter should be in lowercase Arabic numerals. Roman numeration is reserved for theses and books. Only the title page should have no page number, the next page being 2 (not 1). This can be generated automatically in most word processors if the front matter (table of contents, list of figures, etc) are the final items to be created by the software. Page numbering should be centered because the report is only written on the recto. Published material that uses both recto and verso get the page numbering alternatively right then left justified. Sections are numbered and the section title includes the number always preceding the text. A double or triple numeration scheme should be used for subdivision and subsubdivision. These numbers are separated, but not followed by a period. The sections of this manual are properly numbered. Figure, table and equation numbers also use a double numbering scheme. The first digit is the section number and the second is the figure, table or equation number. Tables, figures and equations are numbered independently and hence, there can be a Table 4.2 and a Figure 4.2. Equation numbers are usually set in parentheses justified to the right margin of the equation as shown in Chapter 9. Do not use parentheses when referring to equations in the text; i.e. “Equation 5.2 shows . . . ” is correct. The page numbering of back matter follows on from the main matter. Only Appendices should be lettered. That is, they should be numbered using an uppercase letter starting with A. Subsections and sub-subsections should then be numbered using the same type of scheme as for the main matter. For example, see Appendix A of this manual. The rest of the back matter sections are not numbered or lettered in the same manner as is the preliminary matter. Hence the References and the Index get a title but no division number or letter. 5.6 Titles and Captions Titles and captions are usually capitalized16. Here is what the Chicago Style Manual [1] has to say on the subject:
This is English practice. In French titles, only the first word is capitalized. 5.7 Spelling, Grammar and Punctuation Reports must be free of grammatical errors and spelling mistakes. There is little more distracting than reading a report with spelling mistakes. They seem to leap o. the page, derailing the reader’s train of thought. This is another major reason why word processors should be used. Use the spell checker available with your word processor set to Canadian English to eliminate spelling mistakes. It will help you improve your own spelling. Check a dictionary if you are in doubt. It is worth the thirty seconds. Use a grammar checker if available. Be careful though; many grammar checkers are not very useful for analyzing technical writing. Use them to spot mistakes, but scrutinize carefully any suggestions that appear. Although these tools are useful they are not infallible. A spell and grammar check will approve of the following sentence; Never heed dust under the rug. As a final caution, read the following poem.
It is essential that a report be proofread several times. This includes an independent party reading the report and suggesting editorial changes. It has been shown very effective to leave a draft for a day or so and then proofread it again. This helps to get a fresh perspective on what has been written. 5.8 Writing Style The style of writing should reflect the author’s personality. Generally accepted points on style worthy of consideration include: Avoid writing in the first person, use the passive voice. Do not write “We loaded the specimens into the tension tester. . . ”; it is better to write: “The specimens were loaded into the tension tester...” Avoid slang and definitely avoid clichés. Technical subjects require precise language to deliver convincing arguments and credible discussions. Do not stoop to writing your report like the evening news. If humour is essential, use it sensibly, sparingly and tastefully. A technical report does not need to be choked with technical and pompous terminology that only the author and his/her immediate peers and superiors can understand. The trend today is to write in plain language, and to produce readable documents. The following contains what are commonly called Fumbler rules of English writing. Read them, do not overlook the irony in each, and try to follow as many as possible. If you cannot find the irony, you are likely to miss the point of the rule. 1. Remember to never split an infinitive. 2. Passive constructions are often used, but that does not make them acceptable. 3. Avoid run-on sentences they are hard to read even when short. 4. Do not use no double negatives. 5. Use the semicolon properly, always use it where it is appropriate; and never where it is not. 6. Reserve the apostrophe for it’s proper use and omit it when its not needed. 7. Do not put statements in the negative form when they can be written positively. 8. A subject have to agree with their verb and possessives. 9. No sentence fragments! 10. Proofread carefully to discover if any words left out. 11. If you reread your work, you will often find that on rereading that a great deal of needless repetition can be avoided by careful review and editing. 12. A writer must not shift your point of view. 13. Eschew obfuscation. 14. And never start a sentence with a conjunction. 15. Do not overuse exclamation points!!! 16. Place pronouns as close as possible, especially in long sentences, as of ten or more 17. Hyphenate between syllables and avoid un-necessary hyphens. 18. Write all adverbial forms correct. 19. Don’t use contractions in formal writing. 20. Writing carefully, dangling participles can be avoided. 21. It is incumbent on us to avoid archaic constructions. 22. If any word is improper at the end of a sentence, a linking verb is. 23. Steer clear of incorrect forms of verbs that have snuck into the language. 24. Take the bull by the horns and avoid the can of worms that results from mixed metaphors. 25. Avoid trendy locutions that sound lfaky. 26. Never, ever use repetitive redundancies. 27. Spelling and grammer do count. 28. An author should be careful to use singular pronouns with singular nouns in their writing. 29. If I’ve told you once, I’ve told you a thousand times, resist the hyperbole. 30. Also, always avoid awkward or a.ected alliteration. 31. Do not string too many prepositional phrases together except to demonstrate a point about the structure of sentences for students of English. 32. Always pick on the correct idiom. 33. Avoid overuse of “quotation” marks. 34. It should be noted that it is unnecessary to call special attention to any statement. 35. The adverb always follows the verb. 36. Underlining is not a good way to indicate emphasis. 37. Spell checkers do not always choose the write word. 38. Prepositions at the end of sentences do not work out. 39. A careful writer can avoid gender traps without introducing awkward usages into her or his prose. 40. Last but not least, avoid cliches like the plague; seek viable alternatives. 5.8.1 General Notes on English Writing: It is curious how many people confuse its with it’s. Some people report having even seen its’. The rules are as follows:
Contractions should not be used in technical report writing. Do not write: can’t, isn’t, won’t, etc. Always write the full form: cannot, is not, will not, etc. The abbreviation of for example is e.g., not eg., and it should always be followed by a comma; e.g., refer to the description of its above. The abbreviation of "that is to say" is i.e.The rule for i.e. is the same as for e.g., ie. does not exist. Both these examples are foreign words and should be italicized. Several similar abbreviations are standard, commonly accepted, and may be used without restriction. However, if you are abbreviating something uncommon, technical, etc., you should write it out in full the first time it appears followed, in brackets, by the abbreviation (or acronym) you use thereafter; e.g., a computer assisted report-writing program (CARP) was developed. Then further along . . . The CARP greatly reduced the effort required to write the project report. Use a colon to precede a list, e.g., “The following sections should be included in a report: Introduction, Methods, etc.” Some words are frequently used incorrectly, simply because they sound similar. Among these are:
Learn what these words mean and use them correctly. 5.8.2 Plurals and collective nouns Many English scientific words have plurals that are a throwback to their language of origin. This is confusing to most North American’s and therefore they are almost always incorrectly used. The noun datum or its plural data is by far the most abused. There is no such thing as a single data point, it is a datum. Also, because it is plural, one says data were acquired. A data set is sometimes used to speak of a particular group of data points that have a common criteria. Table 5.2 is a list of preferred plurals of tricky scientific terms.
Figures It is often useful to include pictures, schematics, drawings, graphs, etc. in reports. These help diminish the verbiage that would be required to describe complicated apparatus or important details. The cliché, a picture is worth a thousand words, is certainly true in reports. Keep your figures simple. They should not be used as flashy distractions. Line drawings are preferable to black and white (b&w) plates1 (photographs). Black and white photos are favoured over colour. Many figures are usually more profitable than one large one trying to show everything. Take a hint from the cinema. Scenes start off with a long shot to put the viewer in context. Mid-range shots are then used at the beginning of conversations to identify who is talking to whom. Finally, close-ups are used to catch expressions or emotions. Details of parts should not be thrust upon the reader out of context. Ensure that what is wished to be shown is clearly visible in the illustration. Pictures of polar bears in a snowstorm are not informative. It is also a good idea to describe each figure in a few sentences to make sure the reader understands what the author believes to be significant about the figure. Due to their complexity, the format of graphs will be treated in a separate chapter (Chapter 7). Nevertheless, the following rules for figure identification apply for all types of illustrations including graphs.
Graphs The American Standards Association outlines the do’s and don’ts of making engineering graphs. Their thirteen rules for making graphs are presented here. 1. The graph should be designed to require minimum effort from the reader in understanding and interpreting the information it conveys. 2. The axes should have clear labels that name the quantity plotted, its units, and its symbol if one is in use. 3. Axes should be clearly numbered and should have tick marks for significant numerical divisions. Typically, ticks should appear in increments of 1, 2, or 5 units of measurement multiplied or divided by factors of ten (1, 10, 100, . . . ). Not every tick needs to be numbered; in fact, using too many numbers will just clutter the axes. Tick marks should be directed toward the interior of the figure. 4. Use scientific notation to avoid placing too many digits on the graph. For example, use 50 × 10 rather than 50,000. A particular power of ten need appear only once along each axis; avoid confusing labels such as “Pressure, Pa x 10”. 5. When plotting on semilog or full-log coordinates, use real logarithmic axes; do not plot the logarithm itself (e.g., plot 50, not 1.70). Logarithmic scales should have tick marks at powers of ten and intermediate values, such as 10, 20, 50, 100, 200, . . . 6. The axes should usually include zero; if you wish to focus on a smaller range of data, include zero and break the axis. 7. The choice of scales and proportions should be commensurate with the relative importance of the variations shown in the results. If variations by increments of ten are significant, the graph should not be scaled to emphasize variations by increments of one. 8. Use symbols such as , _ and _ for data points. Do not use dots ( · ) for data. Open symbols should be used before filled symbols. You may place a legend defining symbols on the graph (if space permits) or in the figure caption. 9. Place error bars on data points to indicate the estimated uncertainty of the measurement or else use symbols that are the same size as the range of uncertainty. 10. When several curves are plotted on one graph, different lines (solid, dashed, dashdot, . . . ) should be used for each if the curves are closely spaced. The graph should include labels or a legend identifying each curve. Avoid using colors to differentiate curves, since colors are usually lost when the graph is photocopied. Theoretical curves should be plotted as lines without showing calculated points. Curves fitted to data do not need to pass through every measurement like a dot-to-dot cartoon; however, if a data point lies far from the fitted curve, a discrepancy may be indicated. 11. Lettering on the graph should be held to the minimum necessary for clarity. Too much text (or too much data) creates crowding and confusion. 12. Labels on the axes and curves should be oriented to be read from the bottom or from the right. Avoid forcing the reader to rotate the figure in order to read it. 13. The graph should have a descriptive but concise title. The title should appear as a caption to the figure rather than on the graph itself. Science and engineering practice follows all of these rules except for a minor deviation of rule #3. Recommended practice by most engineering publications is to place the tick marks outside the graph. Also it is sometimes useful to number the scale in different increments than suggested in rule #3; angular degrees are best labeled 30, 60, 90, . . . , inches in increments of six to easily convert to feet. Another exception is to rule #5. Decibels and earthquake strength expressed using the Richter scale should be represented using a linear scale as these units are already exponential. One final derrogation is that the Système International has prefixes. Use them. Proper graphs indicate the origin of both axes. Only by showing the zero can the importance of a trend be compared to an invariable part of the function. Trends that have large y-axis intercepts and small slopes are best represented by a constant and not a line. However, most computer graphing packages do not allow a break in the scale to permit the indication of the zeros of the axes. If you are using a computer graphing package, make sure that you are plotting engineering graphs. Some packages, such as Quattro ProTM or ExcelTM, have graph options that are not suitable for engineering graphs such as the x-y line graph. Do not use these options to plot your graph, since the x-axis scale will be irregular and the graph will be useless. A good way to be alerted to an irregular axis is to watch for oddly numbered ticks (e.g., 49.21, 37.17, 55.43) at equal spacing along the x-axis. These graphs may be useful in the financial world, but they are unacceptable in science and engineering. In general, be careful with line graphs. Do not play connect-the-dots with your data points (rule #10). In most cases, a graph should show a continuous trend even though your experimental data show scatter about the trend. One line type that should be avoided is ExcelTM’s smoothed line. The line is forced (by using a spline) through the data points showing slopes that depend only on the uncertainties of each point. This is not a true trend line as it does not take into account the erroneous nature of the data point without error bars. Always qualify a trend line: fitted by eye, curved using least squares, etc. Never extend a trend line (extrapolate) beyond the error margins of the maximum and minimum data.
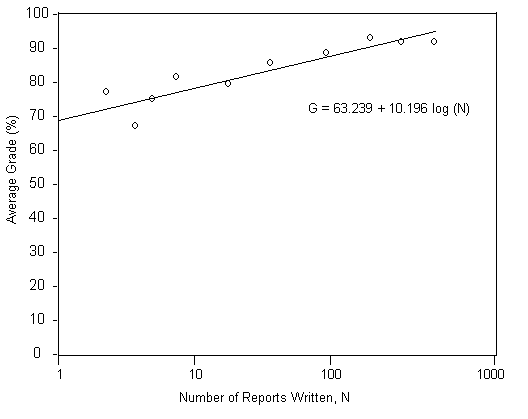
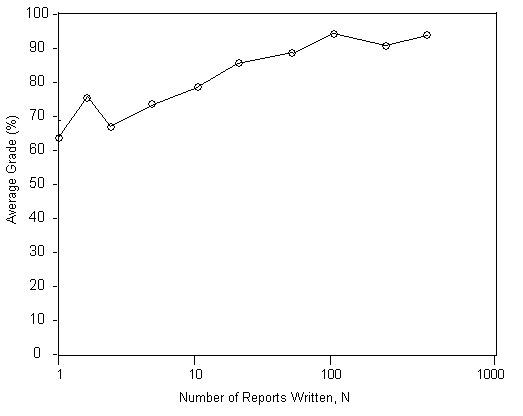
Figure 7.1: A Good Graph of How Writing Experience Affects Students’ Grades Two examples are given below; Figure 7.1 shows how the average grade assigned to written reports improves with the number of reports written by university students (fictitious data). The graph has a reasonable trend line fitted to the data, illustrating that the average grade increases with the number of reports written. Figure 7.2 shows the same data with a connect-the-dots plot. This accentuates discrepancies in the trend which are really due to inadequate sampling or scatter in the data. Avoid plots like the latter.
Figure 7.2: A Poor Graph of How Writing Experience Affects Students’ Grades TablesTables, like graphs, allow us to present large amounts of information in a compact form. This information need not be only data. It could also present an experimental test matrix or a list of material properties. Tables, like figures, are stand alone items. One should be able to remove any table from a report and still understand all the information it contains. Thus they must include all pertinent information required to use the table. This implies that units should be included in the table. Here is a list of rules to follow: • Every table should be referenced in the text. Do not reference tables that are not in the text. • Locate the tables as closely as possible to where they are described in the text, usually on the same page or the next page. Never put a table on a page preceeding its reference in the text. • Any table must have only one caption or title. This caption is placed above the text. Only when a caption contains more than one sentence should it be ended with a period. • The caption should reveal the actual contents of the table and not be a general or nondescript title. Compare:
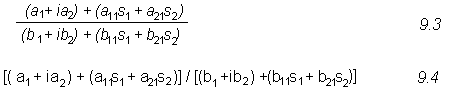
• Reference all tables using a double numeration scheme. Table numbering is independent from the figure numbering. • The list of tables should reproduce the caption that is actually above the table and the page number on which the table appears. Word processors can automatically handle this task, if so configured. • Tables should not spill over into the margins. Use a complete page if necessary. Rotate them if the landscape aspect ratio is more suitable. • For rotated tables (again landscape versus portrait) their bottoms should face as explained in the figures Chapter 6. • Measured variables are set in the columns. For example, a table of fuel properties may have Viscosity, Calorific value, Surface tension as column headers with the different data sets in rows. For this example, rows would specify which fuel. • Column headers are separated from the data with a line. Headers include the variable name (written out, not in symbolic form) and the units of that variable. Some prefer to enclose the units in brackets3. A counter example to this is the gas tables by Keenan, Chao and Kaye [12] or the steam tables by Keenan et al. [13]. One must search through the front matter of these books’ pages to determine the units for the variables presented. • The first column of a table is known as the stub and contains the categories that define the data sets. The stub may or may not have a column heading. • It is sometimes useful to group data into sub-sets. An extra column to the right of the stub will easily allow this. • The typeface size maybe reduced to 8 points if the table is too large. Less than this and the table will become unreadable; thus you need to spread it over many pages. However, large tables are seldom required. Try splitting up the information into smaller chunks and putting them in different tables. This may improve readability. Equations The typesetting of mathematical equations is a complicated matter. The Chicago Style Manual has a whole chapter dedicated to it and even that is lacking the finer points. The American Society of Mathematics has published Mathematics into Type by E. Swanson. The scope of these books is far greater than that required by a student to properly typeset simple equations. One must understand that mathematical equations use a language with nouns, verbs, etc. Swanson gives this simple example: A = B + C (9.1) In this case A, B and C are nouns, + is a conjunction and = is a verb. Prove it to yourself by reading Equation 9.1 out loud. The other misunderstood fact about equations is that when the letter P appears, one should read pressure. Hence equation 9.2 should be read as the pressure of the gas times the volume of the gas is equal to the mass of gas times the gas constant times the absolute temperature. It is not read as pee vee equals em ar tee which is meaningless. The guide to translating the symbols into words is provided in the Nomenclature. P V = mRT (9.2) Here are a few guidelines to correctly set your equations using a modern equation typesetter such as Microsoft Equation EditorTM, Math TypeTM, TEXTM or LATEXTM. Though these mathematical typesetters are a great help, their defaults can cause errors for the layman. For example, the default for most of these software is a scalar variable, hence everything is italicized. This is often incorrect. • Symbols that replace a number (variables or constants) should be italicized. Hence it is p for pressure and not p. It is c (velocity of light in vacuum, a constant) not c. This is also true for indices and exponents. The specific heat of a gas at constant pressure is cp not cp nor cp. • Symbols that replace a word (often used in indices or in chemistry) are set using the roman1 typeface. So the enthalpy of air is Hair not Hair. All chemical symbols (H, He, Li, Be, . . . ) and mathematical symbols (+, =, ×, . . . ) follow this rule. • Scalars are written in italics, vectors in bold italic typeface and tensors in bold italic sans serif. V is velocity and V is speed. • When expressions include units, there is an unbreakable thin space between the value and the units. Most equation typesetters allow variable spacing. 150MPa is appropriate whereas 150 MPa is not. Look closely, you can see a difference. • The multiplication symbol, ×, should only be used between numbers (not variables) or to indicate a vector product. Do not use it between scalar variables as a space success to indicate the product. • Use scientific or engineering notation. Do not use computer programming syntax to express numbers. The value of Avogadro’s number is 6.023 × 10²³ not 6.023E23 nor 6.023e23. This usage was forced upon us because early computer output had but one font and no way of indicating subscripts or superscripts. This is still true in some programmes like Microsoft ExcelTM whose programmers think scientific notation requires a capital e. Most of these problems can be avoided by a proper use of the SI. • Fractions are a common pitfall. Use the solidus, /, with caution. Parentheses help but can become unwieldy. Use Equation 9.3 instead of Equation 9.4:
• Try to avoid long subscripts and superscripts. When using variables with many subscripts, the subscripts are separated by commas. • Instead of repeating parentheses to mark groupings and sub-groupings, alternate between parentheses, brackets and braces preferably in this order: {[()]} • Use the verb or conjunction to break long equations. • These rules are true for mathematical symbols no matter where they appear in the text. Do not write a scalar variable symbol in roman because it is in a paragraph. It should always appear in italics. 9.1 Units and ValuesSI units should be used at all times unless expressly requested by the instructor3 If values are needed in a different unit system, add them in parentheses. This is useful when stating values that were standardized using a different unit. For example: “Nails should be placed every 40.6 cm (16 in.) to line up with the center of the studs.” The SI has prefixes which should be used and are reproduced in Table 9.1. 1.2GPa is the correct way of expressing 1 200×106 Pa. This helps avoid the use of scientific notation in graphs.
Table 9.1: SI Prefixes from Quantities and Unites The SI recommends the comma as a radix point4 but a dot is acceptable if it is placed on the line (.) not half high ( · ). A cipher should always be used in the unit place of all values less than one; i.e. use 0.123 not .123. To facilitate the reading of numbers with many significant digits, digits should be grouped into threes. Starting from the decimal point, separate each group of three decimals and/or integers with a thin space never a comma. Hence 1234.56789 should be set as 1 234.567 89. You will, however, rarely have to write numbers with more than 5 significant digits. 9.2 Choice of NomenclatureThe choice of which symbol represents which variable is often difficult. The English alphabet having but 26 letters can be augmented by the Greek one. The Greek upper case letters are usually restricted to describe functions. There are many upper case Greek letters that are the same as the Latin ones (alpha, beta, epsilon, etc.). The commonly used mathematical functions or operators are also given. The International Organization for Standardization, ISO, has published many standards giving the nomenclature to be used in certain fields of study. It also has defined what SI should be. All of these standards are available in Quantities and Units. Many operators have been attached to certain symbols. Those common in mechanical engineering are given in Table 9.3. Also included in that table are the preferred ways of writing certain functions. The variable x is used to clarify the notation.
Table 9.3: Common Engineering Operators of Functions Quotations, Paraphrases, Plagiarism and CopyrightThe reader of a report expects that the work presented is that of the authors named on the report. However, this does not mean that only work done by these authors must appear in a report. Information gathered from other sources can be included if proper reference is given. The two methods commonly used are quotation and paraphrasing. 10.1 QuotationSometimes it is useful to include words or sentences from a different author that eloquently express what is trying to be communicated. Quoted material should reproduce exactly what was said or written. This includes spelling, punctuation and mistakes. The quotation of the thirteen rules for making graphs contain the American spelling of colour; see 10 on page 38. Fowler's comments on quotation reproduced on page 50 uses the ampersand to indicate where the author used and. Both these example are proper quotation even though they respectively contravene this author preference or modern typesetting practice. Find a reliable source for the quoted material. The poem about spell chequers reproduced on page 28 circulates regularly through emails and on the internet. A five-minute search on the net allowed me to locate the original author and the original publication in a published journal and later reproduction [9] in the same journal. The reliable source should also be included as a reference. Quotations are either run in (included in a paragraph) or set off (in their own paragraph). Usually short quotations are run in and quoted matter that is longer than eight lines is set off. However the nature of the material might justify a shorter paragraph being set off. Many rules exist to properly quote full sentences or parts of sentences. One should consult the Chicago Style Manual or the style section of a reputable dictionary (yes, they have a style section). 10.1.1 Run inIf a quote is set in a paragraph, the author should try to make the transition as smooth as possible. The quoted text is differentiated from the main matter by quotation marks (“”). Fowler [7] warns that “a writer expresses himself in words that have been used before because they give his meaning better than he can give himself . . . or because he wishes to show that he is learned or well read. Quotations due to the last motive are ill advised . . . ” The previous quote also shows the correct use of the ellipsis (. . . ). 10.1.2 Set offLong or very important quotes are given a paragraph of their own with wider margins. This is distracting to the reader but this effect can be used to advantage. This special treatment means that no quotation marks are required. To repeat Fowler’s [7] warning in its entirety:
10.2 ParaphraseParaphrasing is summarizing or expressing the idea or argument in different words than those used by the original author. It is common practice in reports when it is advantageous to use someone else’s argument or opinion. This requires a reference to properly attribute the work to its creator. If no reference appears, even if it is unintentional, then it is plagiarism. 10.3 PlagiarismPlagiarism is the appropriation of the work of another as your own. The work need not be only the actual written text but includes the thoughts (ideas) or the inventions in the broadest sense. Plagiarism is a direct violation of not only the College’s but of the scientific community’s code of ethics. The seriousness of this transgression usually warrants that action be taken under sections 22.2 of the academic regulations of the College (available in the undergraduate calendar). 10.4 CopyrightCopyright is a legal right given to the author of a work allowing him to profit from said work. This does not forbid anyone else from reproducing the work but put limits on how this can be accomplished. The copyright law allows the fair use of an protected material. For example you can reproduce the sound recording of your bought compact disc but it is illegal to give away such a copy to a friend. However, it is legal in Canada to reproduce copyrighted material in a report if it falls under the fair use clause of the copyright law. As it pertains to us, fair use implies that the material is properly attributed to its original author, that it is less than 15% of the total original work and that the new work in which the copyrighted material is to be reproduced is to be used solely for educational or research purposes. Bibliography [1] The University of Chicago. A Manual of Style. The University of Chicago Press, fourteenth edition, 1993. [2] International Organization for Standardization. Quantities and Units. International Organization for Standardization, third edition, 1993. UDC 389.15, ISO STANDARDS HANDBOOK. [3] J. A. Stratton. Electromagnetic Theory. McGraw-Hill, 1941. [4] M. A. LaViolette. Mesure non-intrusive de la temperature de flamme. PhD thesis, Universit´e Laval, 1999. [5] J. B. Heywood. Internal Combustion Engine Fundamentals. McGraw-Hill, 1988. [6] E. S. Raymond. The on-line hacker jargon file, available at http://www.tuxedo.org/Üesr/jargon/jargon.html Version 4.3.1, 29 JUN 2001. [7] H. W. Fowler. A Dictionary of Modern English Usage. Oxford University Press, 1944. [8] Jerrold H. Zar. Candidate for a pullet surprise. Journal of Irreprodicble Results, 39, 1994. [9] Jerrold H. Zar. Candidate for a pullet surprise. Journal of Irreprodicble Results, 45, 2000. [10] W. Safire. On language. New York Times Magazine, page 16, November 1979. [11] American Standards Association. Engineering and Scientific Graphs for Publication. American Society of Mechanical Engineers, July 1947. [12] J. H. Keenan, J. Chao, and J. Kaye. Gas Tables: International Version. John Wiley and Sons, second edition, 1983. [13] J. H. Keenan, F. G. Keyes, P. G. Hill, and J. G. Moore. Steam Tables. John Wiley and Sons, 1983. International edition - Metric units. [14] E. Swanson. Mathematics into Type. American Mathematical Society, updated edition, 1999. ColophonThe Canadian Oxford Dictionary defines a colophon as
Part of this work is the result of many different inputs under the editorship of Prof. Marc LaViolette. Over the last 30 years, many trials have been made to guide the Royal Military College’s mechanical engineering students towards better writing. This is a collated and revamped version of all the information that was distributed to the students. Although much of the source material has been lost, the traceable material was authored by Prof. David Duquesnay, Prof. Mike Bardon, Prof. Craig Moffatt, Prof. Ernst Eder, Prof. Habib Benabdallah and Prof. Marc LaViolette. Furthermore, a large part was added by Prof. Marc LaViolette to fill in large gaps in the material. |